TV Audience Analytics

Highly Efficient TV-Quota Analytics
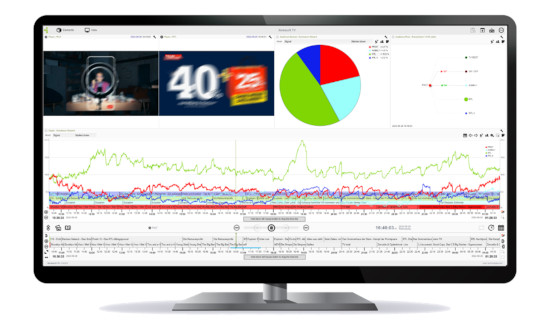
Visualise your broadcast audience and turn your viewing statistics into monetary assets easily with XENTAURIX RatingAnalyzer. Understanding polling statistics from GFK, Nielsen, Gallup, TNS, etc. and how these relate to your broadcast audience is a challenge, especially with flat text import data, non-visual cues and no visual relation to real-time aired programming requires imagination and educated guess work. XENTAURIX RatingAnalyzer releases your polling data (GFK, Nielsen, Gallup, TNS, etc.) cross referencing broadcast programming from all stations and provides graphical representations in ‘true-time’ of what actually happened with your audience.
Station/ Target Audience Comparison
Easily understand your audience viewing trends, did they turn-off or switch over? What age range and demographics were watching? How effective was an advertisers advert? How many viewers were watching? Monetising and understanding your audience is now easy with XENTAURIX RatingAnalyzer.
Audience Spread, Affinity, Audience Flow Analytics
Compare broadcast channels side-by-side with actual broadcast content in ‘true-time’ and easily build visual trending data to share with your advertisers, producers and programme editors to maximise advertising revenue and audience viewership.
